Some key graphs from the "sophia2013" doc above :
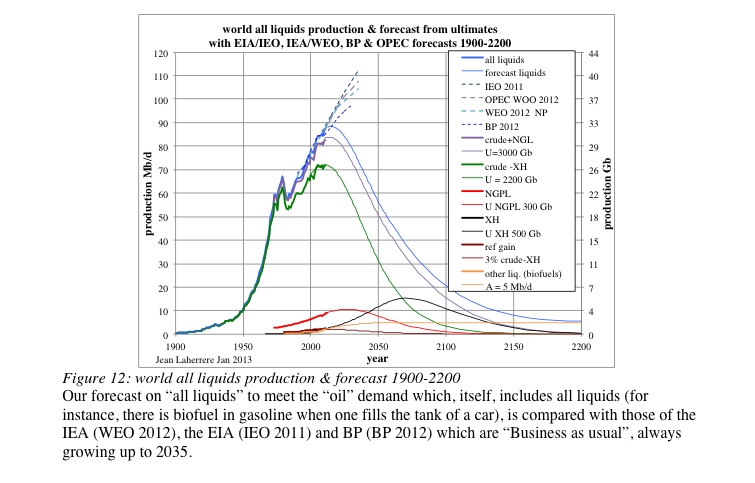
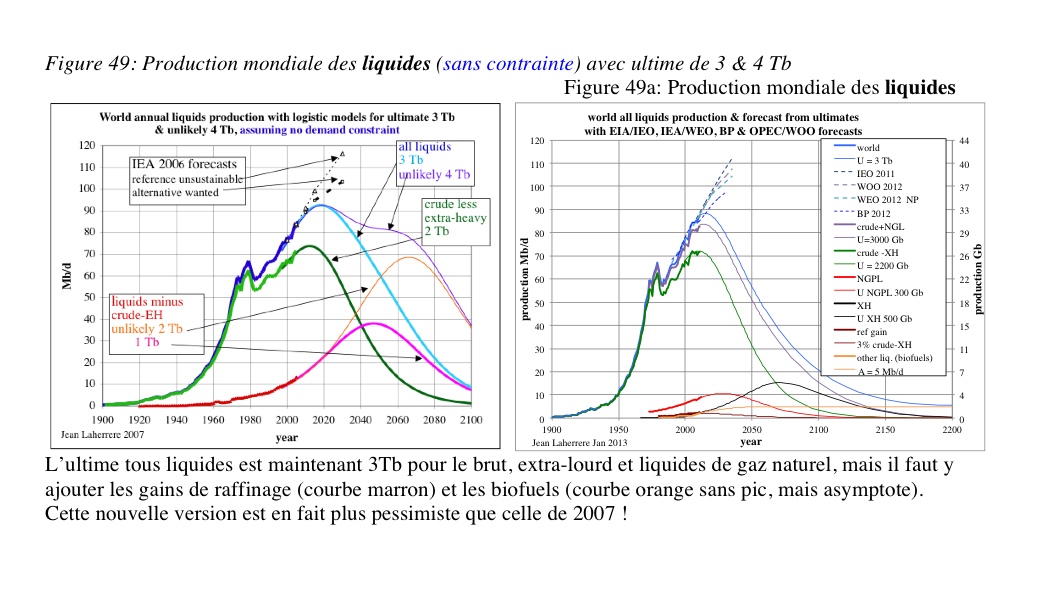
All liquids previsions 2007 and 2013 :
Coal previsions 2007 and 2013 :
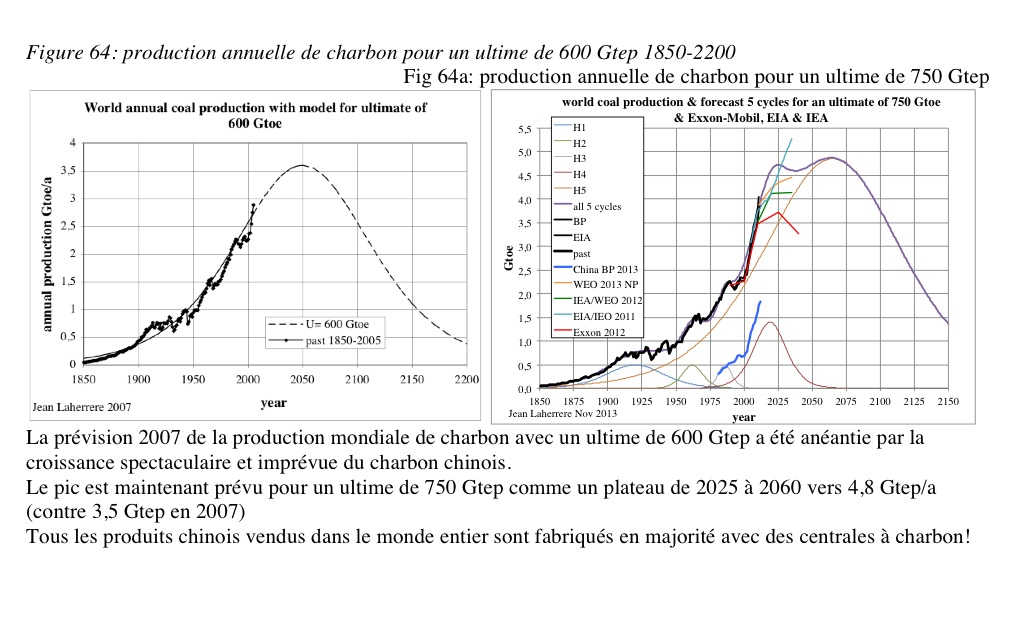
Coal China :
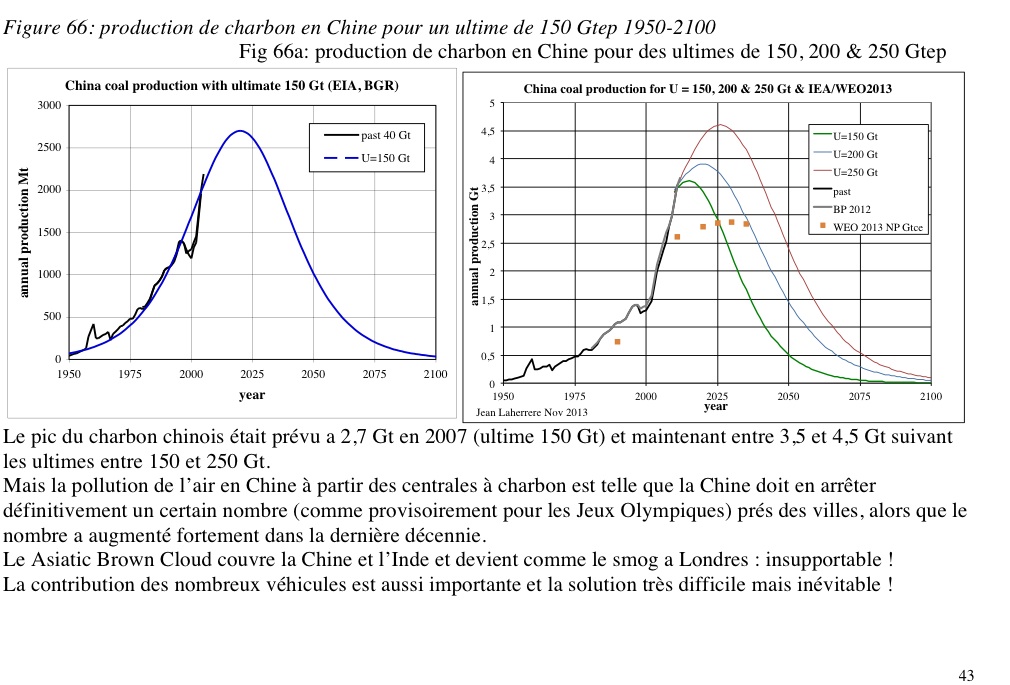
Note that the IEA (WEO 2013) forecasts China future coal prediction below the "possible", and probably the only thing they put below the possible ...)
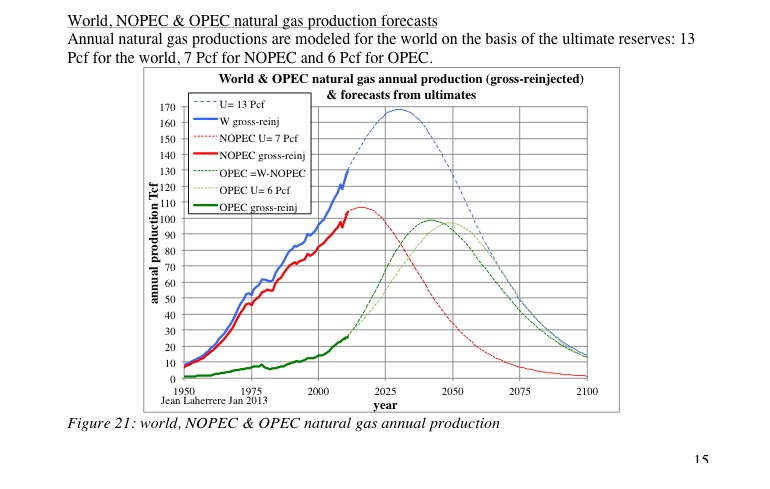
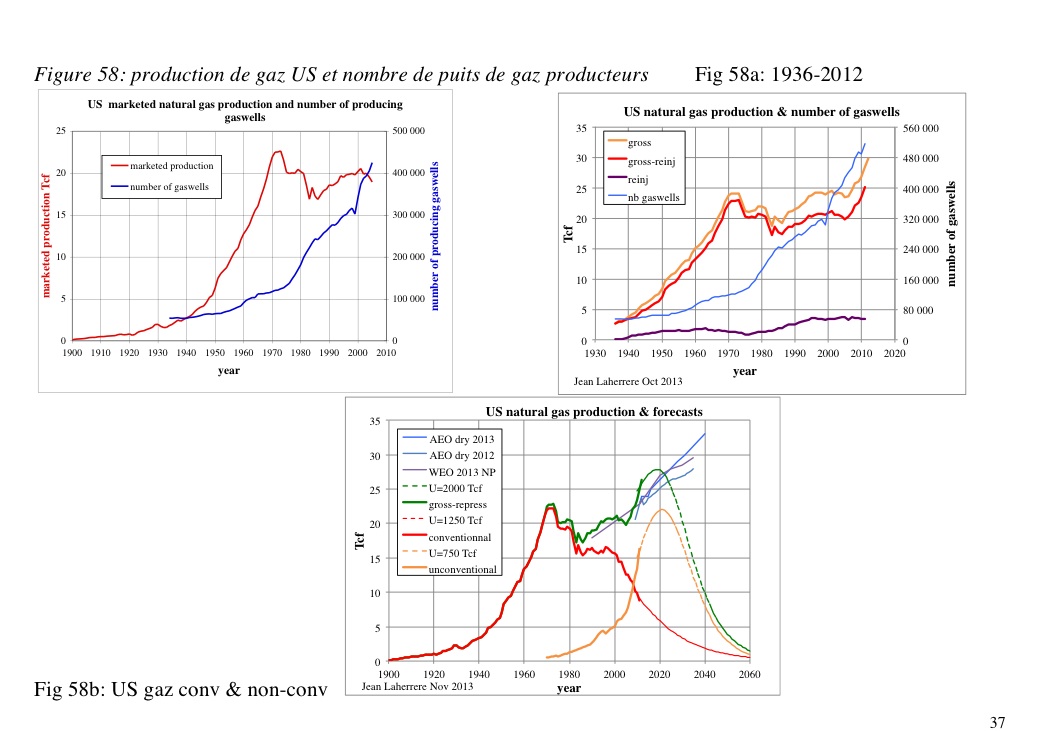
US natural gas :
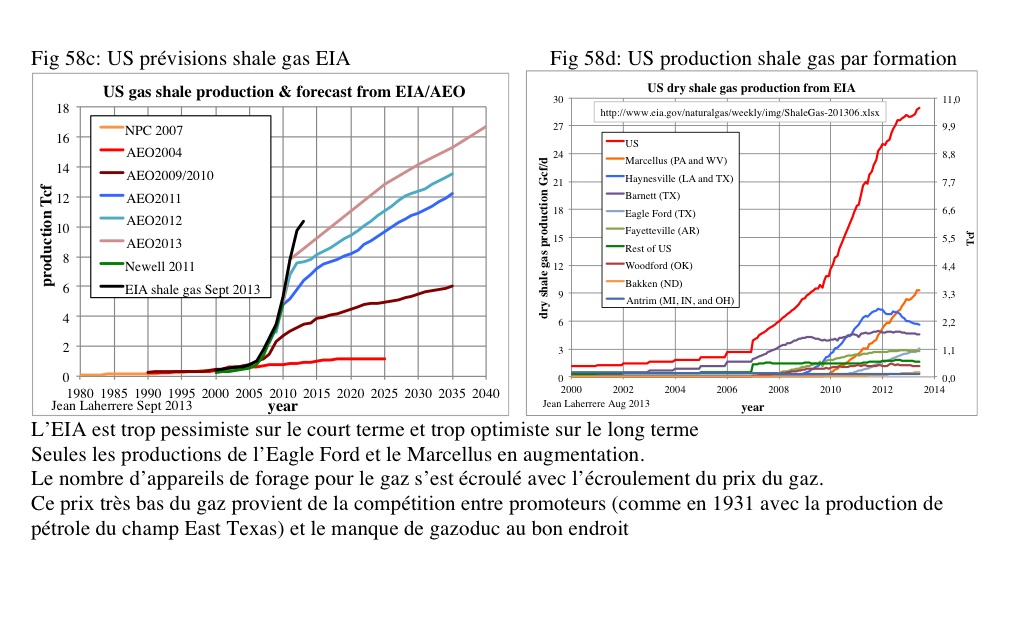
US shale gas :
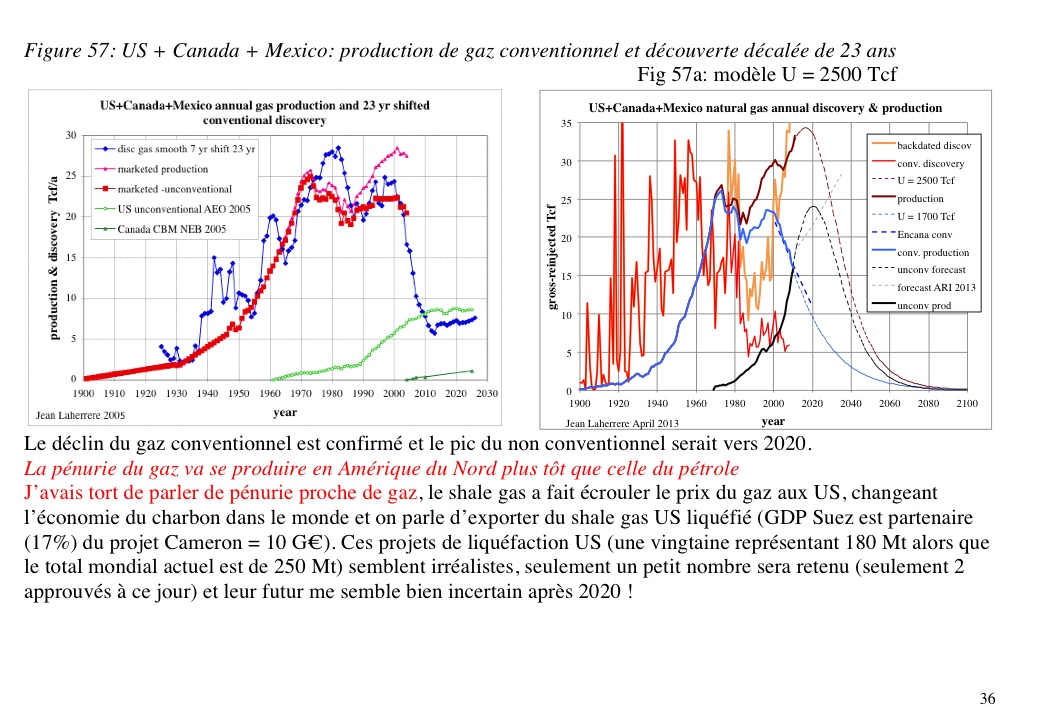
North America conventional gas :
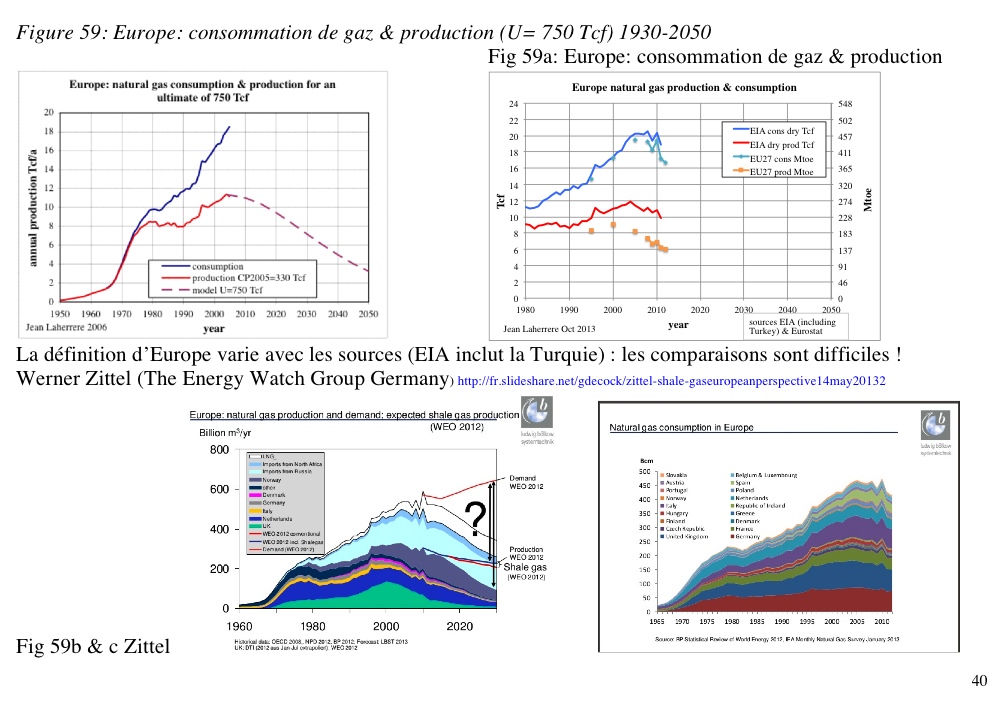
Europe gas :
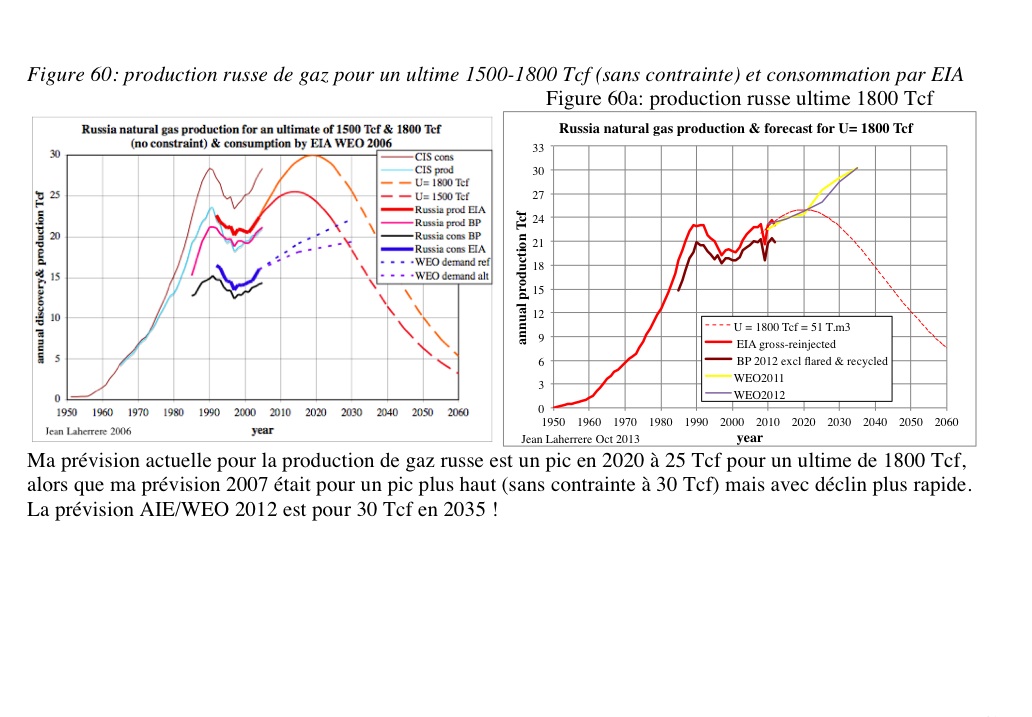
Russian gas :
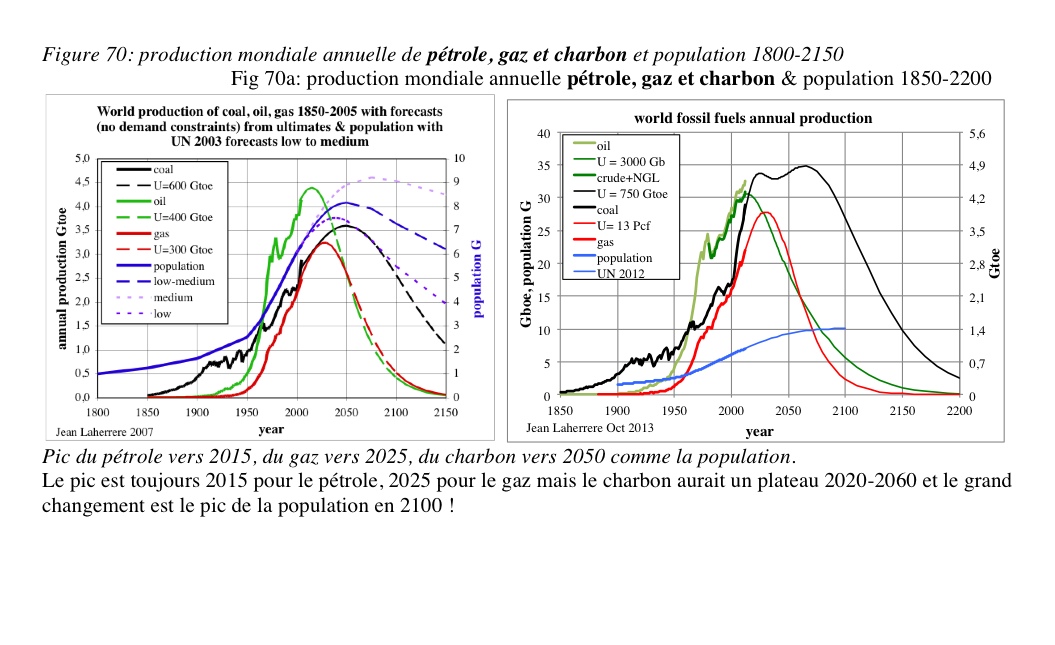
All fossils 2007 and 2013 :
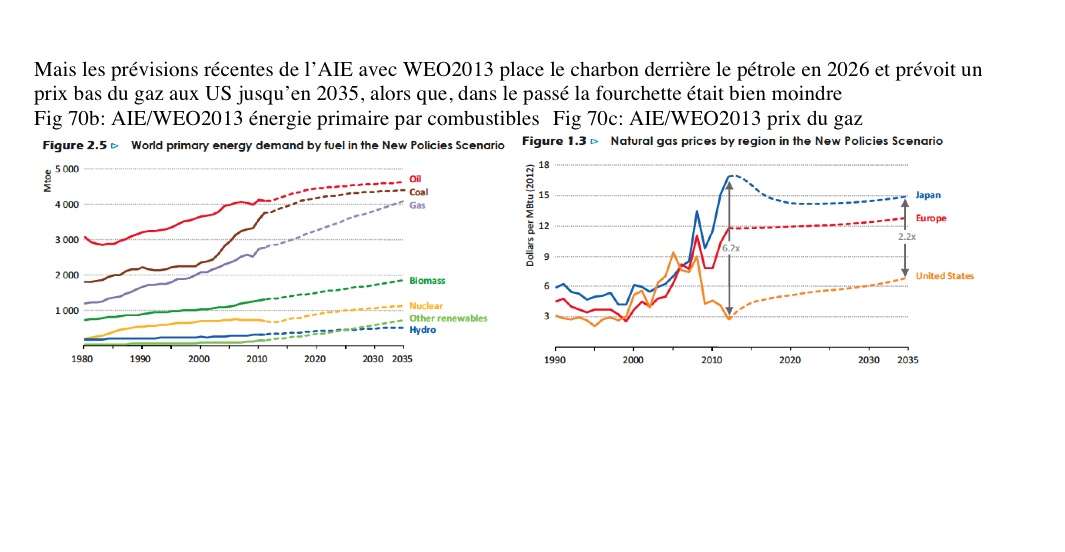
All fossils according to the IEA (WEO2013) :
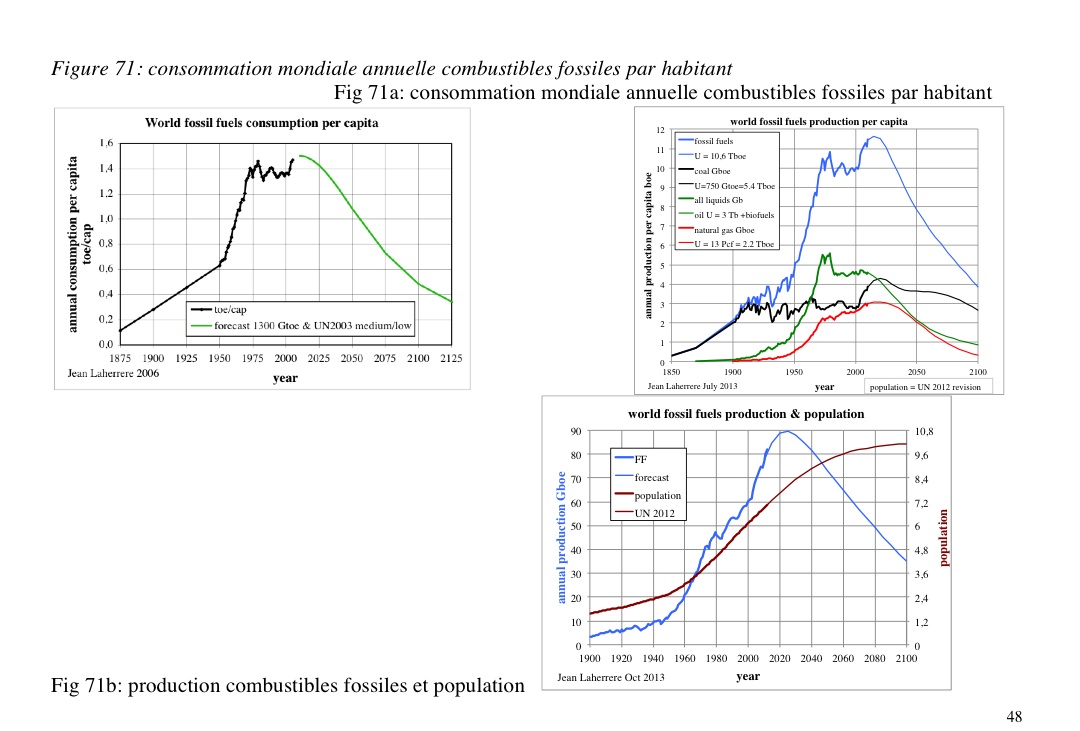
All fossils per capita :
All fossils US and GDP :

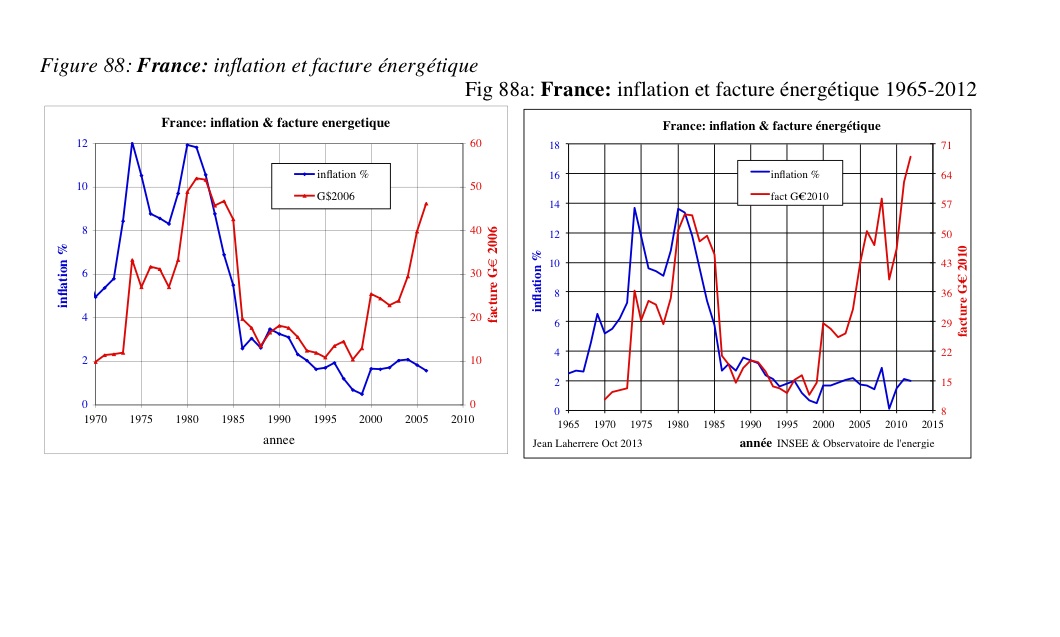
France and energy bill :