http://www.treehugger.com/files/2011/06 ... report.php
'The 2010 edition of the annual State of the Climate Report is out. It's findings should come as little shock to avid TreeHugger readers and climate watchers. Atmospheric CO2 continues to climb, global average temperature continues to rise, glaciers continue to melt, Arctic sea ice continues to retreat dramatically each summer, oceans continue feel the heat.
The report is the product of nearly 370 researchers in 45 countries and appears in the June 2011 issue of the Bulletin of the American Meteorological Society.
Among the report's key findings:
Atmospheric CO2 concentrations are now at 394ppm, up 2.6ppm from the previous year.
Global average temperature in 2010 was warmer than the 20th century average for every month in the past quarter century.
2010 tied with 2005 for the warmest year on record.
Global sea surface temperatures in 2010 were the third-warmest on record.
Alpine glaciers shrank for the 20th consecutive year.
Arctic summer sea ice was at the third lowest level on record.'
Jon
Sate of the climate report 2010
Moderator: Peak Moderation
-
RGR
Re: Sate of the climate report 2010
[quote="ujoni08"]
Last edited by RGR on 12 Aug 2011, 06:28, edited 1 time in total.
-
kenneal - lagger
- Site Admin
- Posts: 14287
- Joined: 20 Sep 2006, 02:35
- Location: Newbury, Berkshire
- Contact:
While the sea ice extent for May is about the same as last year, which was not good,
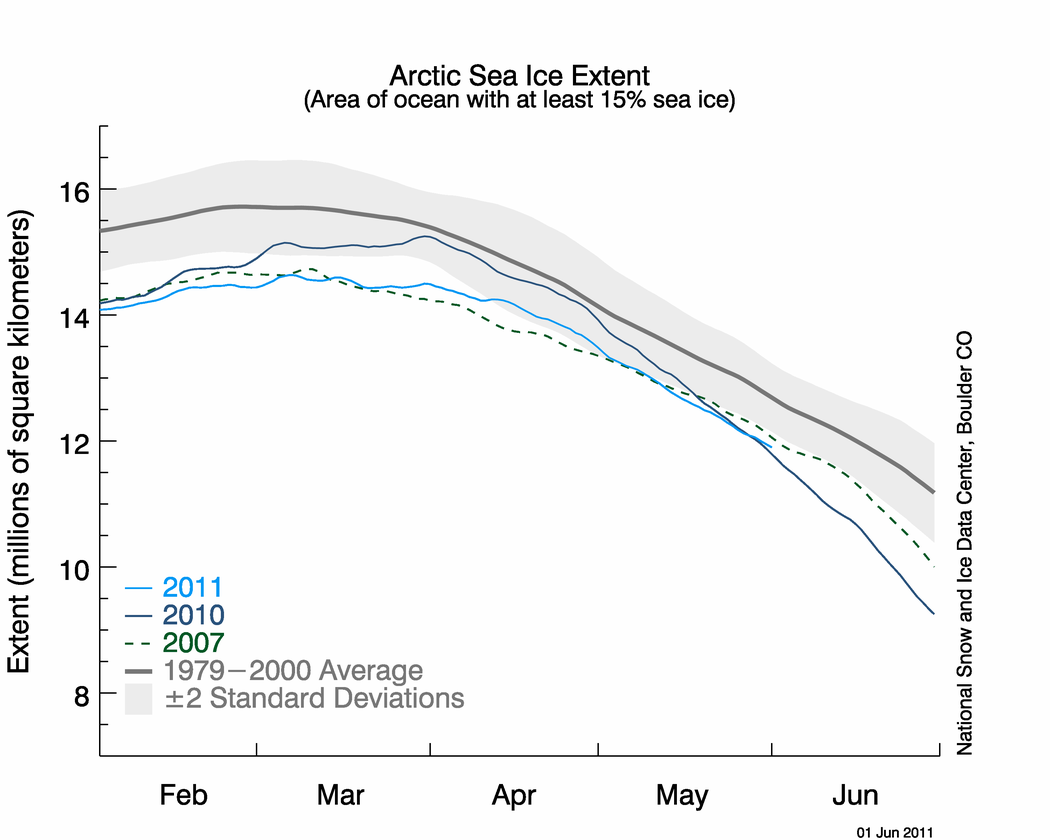
the ice volume is still on a downward trend


If you look at what the proponents of Solar based warming say they are pretty mixed up. On the one hand they are saying that the sun is doing the warming but on the other hand solar scientists are saying, and it's backed up by the current sun spot cycle, that we are entering a quiet phase of the sun, similar to a Maunder minimum.
We are conducting the largest ever experiment with life on earth and possibly the most dangerous. We'll know the result in 40 to 50 years.
the ice volume is still on a downward trend
If you look at what the proponents of Solar based warming say they are pretty mixed up. On the one hand they are saying that the sun is doing the warming but on the other hand solar scientists are saying, and it's backed up by the current sun spot cycle, that we are entering a quiet phase of the sun, similar to a Maunder minimum.
We are conducting the largest ever experiment with life on earth and possibly the most dangerous. We'll know the result in 40 to 50 years.
Action is the antidote to despair - Joan Baez
-
biffvernon

- Posts: 18538
- Joined: 24 Nov 2005, 11:09
- Location: Lincolnshire
- Contact:
-
An Inspector Calls
It seems a pity to spoil a good story with some tiresome facts, but:
The earth is not continuing to warm in either the oceans or the atmosphere:
Global Ocean heat Content
http://www.nodc.noaa.gov/OC5/3M_HEAT_CONTENT/
Lower tropsphere does not show unequivocal continued warming:
http://www.ssmi.com/msu/msu_data_descri ... nd_map_tlt
and:
http://pielkeclimatesci.wordpress.com/2 ... untsville/
Seems this is a somewhat biased report.
Sea Ice: where's the melt:
http://www.climatechangefacts.info/Toda ... rends.html
-
biffvernon
- Posts: 18538
- Joined: 24 Nov 2005, 11:09
- Location: Lincolnshire
- Contact:
-
kenneal - lagger
- Site Admin
- Posts: 14287
- Joined: 20 Sep 2006, 02:35
- Location: Newbury, Berkshire
- Contact:
If you look at both the graphs that you have presented there is a clearly visible downward trend from 2000. Small, but nevertheless, downward. But that is the area of ice. More important is the volume and the PIOMAS graph above clearly shows that there is a definite downward trend of 2800 km^3/decade for the volume.An Inspector Calls wrote:...........Sea Ice: where's the melt:
http://www.climatechangefacts.info/Toda ... rends.html
If you cannot see, and acknowledge, that the decreasing volume of ice is more important than the also decreasing area then I must assume that you are deliberately trying to mislead people.
Action is the antidote to despair - Joan Baez
-
An Inspector Calls
-
kenneal - lagger
- Site Admin
- Posts: 14287
- Joined: 20 Sep 2006, 02:35
- Location: Newbury, Berkshire
- Contact:
-
An Inspector Calls
Where did I ever make a point about volume in the first place? It's your strawman point.
I've posted a graph on sea ice area, which has hardly changed over the past 30 years. The graph and link are clearly marked AREA. No mention of volume.
It seems stretching a point to claim, as you're trying to do, that actually the area might not have changed, but the volume has. And your Arctic graphs would suggest that area and volume change go hand-in-hand.
If you want to make the point about volume, go ahead - but you haven't done it properly yet.
I must assume that you are deliberately trying to mislead people.
-
RGR
-
An Inspector Calls
-
kenneal - lagger
- Site Admin
- Posts: 14287
- Joined: 20 Sep 2006, 02:35
- Location: Newbury, Berkshire
- Contact:
Even the graph you published show a reducing trend for the area. The graphs I published also show are reducing trend for area. So if the area and the volume continue to reduce there will come a time when, in summer, there will be no ice left in the Arctic. As the ice volume reduces there is less carry over of ice from one year to the next so the ice becomes thinner and more likely to melt in the next summer. It's one of those feedback systems.
A lack of summer ice would then cause a severe problem for the Greenland Ice Sheet as the surrounding ocean will warm much quicker and to a higher temperature than with summer ice. It will erode the edges of the ice sheet at a far greater rate than at present as water carries more heat than air, which is causing most of the melting at the moment.
A lack of summer ice would then cause a severe problem for the Greenland Ice Sheet as the surrounding ocean will warm much quicker and to a higher temperature than with summer ice. It will erode the edges of the ice sheet at a far greater rate than at present as water carries more heat than air, which is causing most of the melting at the moment.
Action is the antidote to despair - Joan Baez
-
RGR
-
An Inspector Calls
Oh do come on. Between 1979 and 2005 there's no trend, upwards or downwards in global sea ice area whatsoever. There's the merest smidgin of an area decrease since 2005, well within normal variations.kenneal wrote:Even the graph you published show a reducing trend for the area.
I think it's extremely unlikely, given that lack of global area change, that there's been any significant change in global sea ice volume. Any change in ice depth should, logically, be restricted to the fringes of the ice sheets. So it's rather a flight of fancy to predict a disaster on the back of that lack of evidence of significant area change.