Page 1 of 1
When will the Arctic be ice free
Posted: 08 Feb 2013, 21:09
by biffvernon
Look at the error bar on the 2013 forecast - red dashed line.
 http://arctic-news.blogspot.ca/2013/02/ ... pdate.html
Posted: 08 Feb 2013, 22:08
by RenewableCandy
F-e-e-e-ck!
Took Fille to see Chasing Ice the other day. It has a kind of "While Ye May" feel about it.
Posted: 09 Feb 2013, 11:31
by Tarrel
I haven't the time or the inclination now, but I'm sure if I pulled the old textbooks off the shelf I could work out what this means in terms of additional solar energy absorption each year (taking account of albedo of sea ice vs. albedo of water, area of reduced ice cover, amount of time it's reduced for, etc). However, it doesn't take much working out to see that we are looking at a major positive feedback loop in action here.
Interesting to note that the severity of the snowstorm currently hitting North America is partly due to elevated sea surface temperatures.
Posted: 13 Feb 2013, 19:40
by biffvernon
Here's a pretty informative article from the BBC on ice thinning, as revealed by the Cryosat data:
http://www.bbc.co.uk/news/science-environment-21437680
Published paper: CryoSat-2 estimates of Arctic sea ice thickness and volume
http://onlinelibrary.wiley.com/doi/10.1 ... 3/abstract
Posted: 13 Feb 2013, 22:23
by Mean Mr Mustard
Perhaps there will be cruises on luxury liners to the North Pole?
Posted: 14 Feb 2013, 05:31
by Billhook
Tarrel - a few months back I asked Tamino (who runs the 'Open Mind' site, and whose mathematical skills are to me astounding) to run the numbers on the CO2e of the additional solar influx due to cryosphere decline.
This he kindly did and posted a report describing his methodology and his findings, which were that present albedo loss due to snow & ice cover decline imposes a forcing equivalent to about 30% of our CO2 output.
The difference of course is that the forcing is effective now in high latitudes, while the present CO2 output's warming will not be realized for another 30 years or so.
It was good to see this finding since it fully confirmed one published in GRL back in 2010, which seems to have been studiously ignored by a scientific community that lacks effective means to model the feedbacks' development, let alone their interactions.
Regards.
Lewis
Posted: 14 Feb 2013, 09:39
by PS_RalphW
Here are a couple of graphs to demonstrate the rate of loss
http://haveland.com/share/arctic-death- ... 201301.png
Each coloured line is the ice volume in a given month over the range
1979 -2012/3
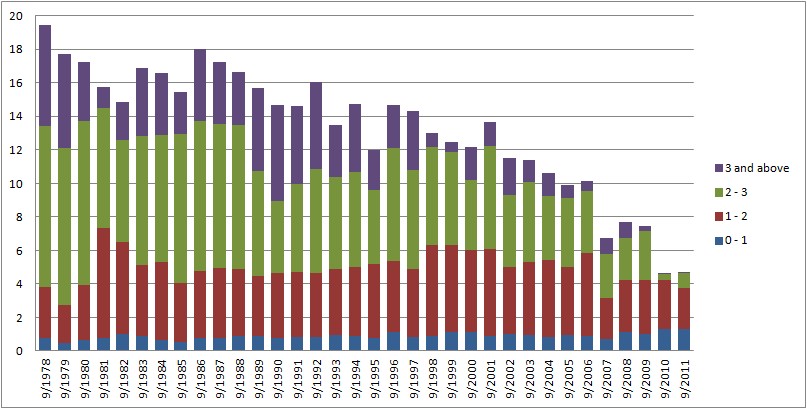
http://farm9.staticflickr.com/8041/7912 ... 6aa1_o.jpg
That's the volume of sea ice (PIOMAS) each septemeber contributing to various thickness bands (4 bands, each of successive splits of 1m.)
There is a good chance that the north pole will be accessible by ordinary boat this september.