Page 1 of 1
New forecasts synthesis from Jean Laherrère
Posted: 25 May 2013, 21:09
by Yves75
Below a new synthesis from Jean Laherrère (oil and natural gas forecasts ) :
http://tribune-pic-petrolier.org/wp-con ... ai2013.pdf
Key graphs :
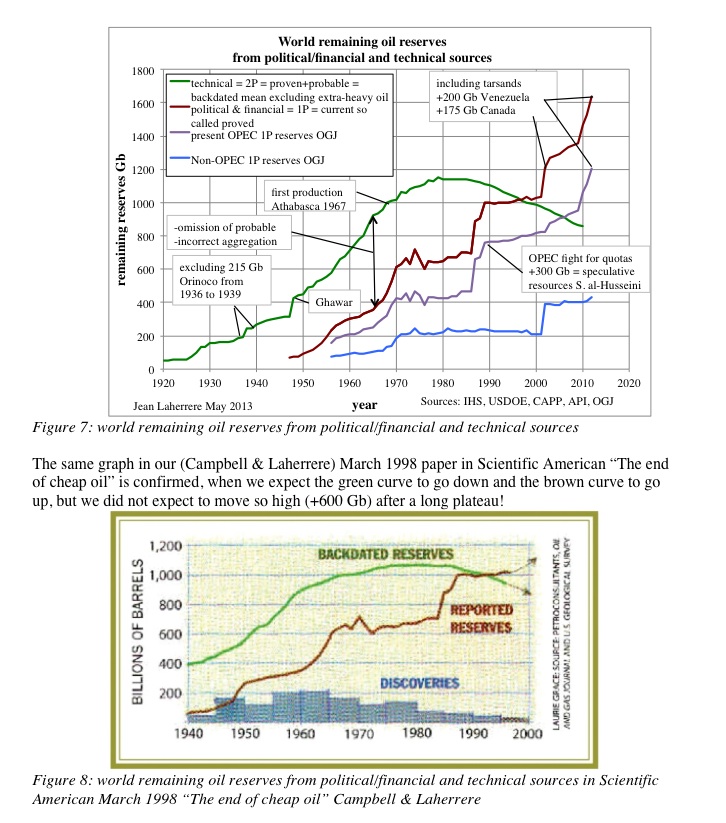
Reserves :
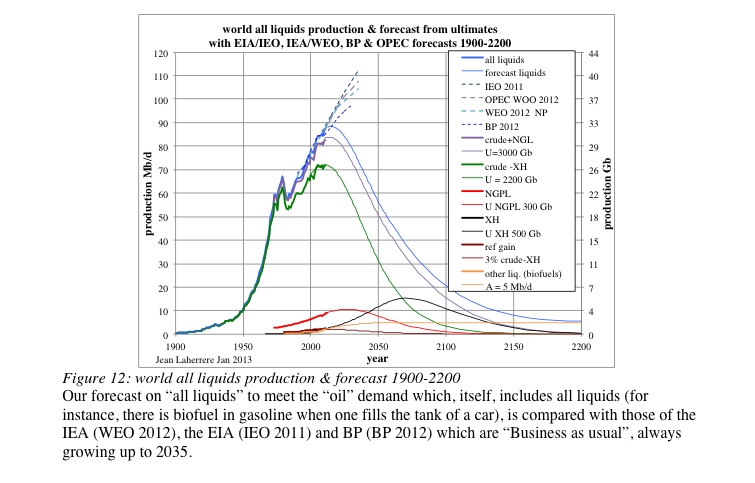
All liquids :
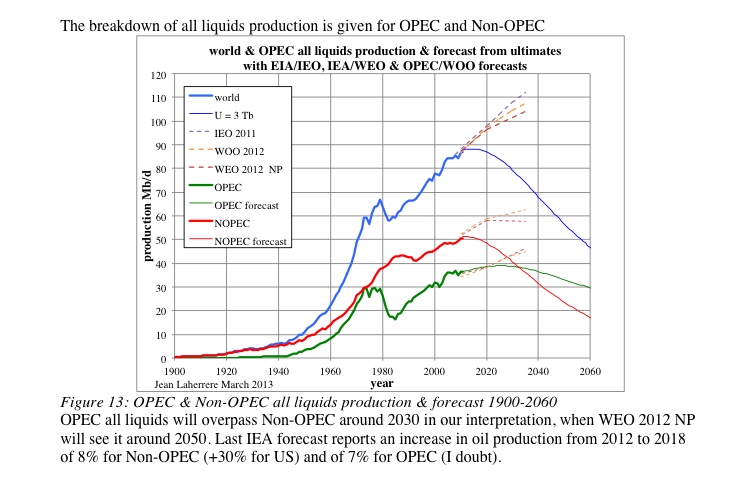
All liquids Opec NOpec breakdown
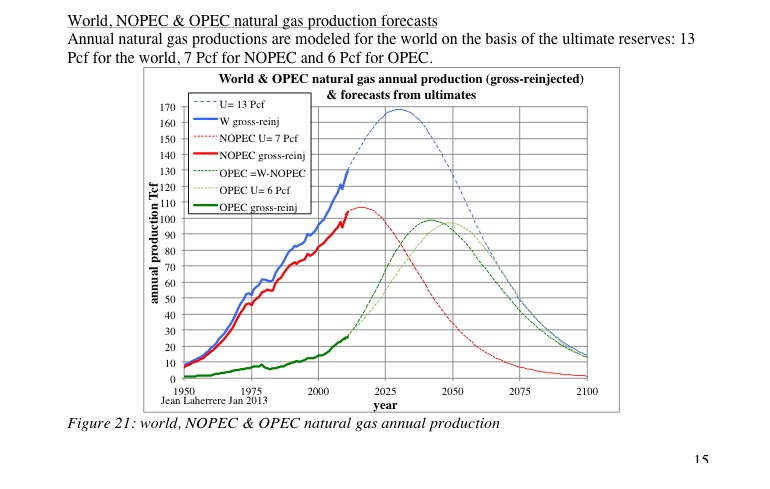
Natural gas :
Posted: 26 Sep 2013, 12:01
by Yves75
And one should probably add the price curve for the global picture :
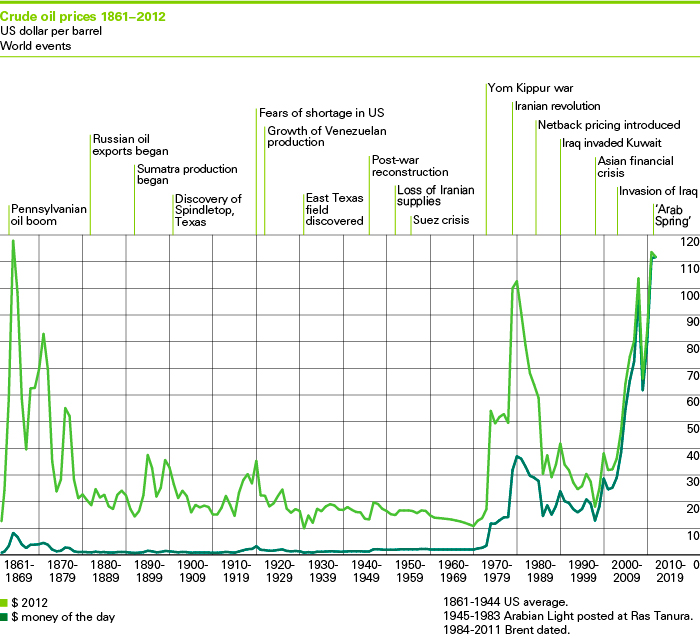
Note : One can notice above the usual "legend" :
First oil shock = Yom Kippur/Arab embargo = geopolitical story = nothing to do with geologic constraints.
When the first oil shock was much more a direct consequence of US 1970 production peak, and rebalance of barrel revenus between majors and producing countries at the time.
Or in other words, the rise of the barrel price was a win win situation at the time, and wished for by majors and US/western diplomacy, summary below for instance :
http://patzek-lifeitself.blogspot.fr/20 ... 3773638550
Posted: 01 Dec 2013, 00:10
by Yves75
Two new docs from Laherrère (in French, but graphics quite self explanatory and labels in English) :
http://aspofrance.viabloga.com/files/Sophia2013.pdf
http://aspofrance.viabloga.com/files/Nice2013long.pdf
First one especially is a global synthesis with also his forecasts for coal.
These numbers (and the amazing current discrepancy with the "official ones" and "public perception") really quite scary ...
Posted: 01 Dec 2013, 00:46
by Little John
Thanks for this info Yves75. Will take a look at this data.
Posted: 01 Dec 2013, 04:44
by kenneal - lagger
Peakists have always said that even tripling the world oil reserve would only put the peak back by 20 to 30 years. This is nothing in terms of the timescale it takes for the human mind to accept that something has to be done. TPTB have ignored all entreaties over peak oil to date and they are now feeling justified because we have "tight oil and gas to last a century." When we will be coming up to the new peak in 20 years time they will be equally blase about it but it will be too late by then.
Mind you the cost of all this new oil might not be something that the world economy can work with so we might not have to worry about a peak further down the road. The road might have collapsed before then.
Posted: 01 Dec 2013, 11:45
by Yves75
Some key graphs from the "sophia2013" doc above :
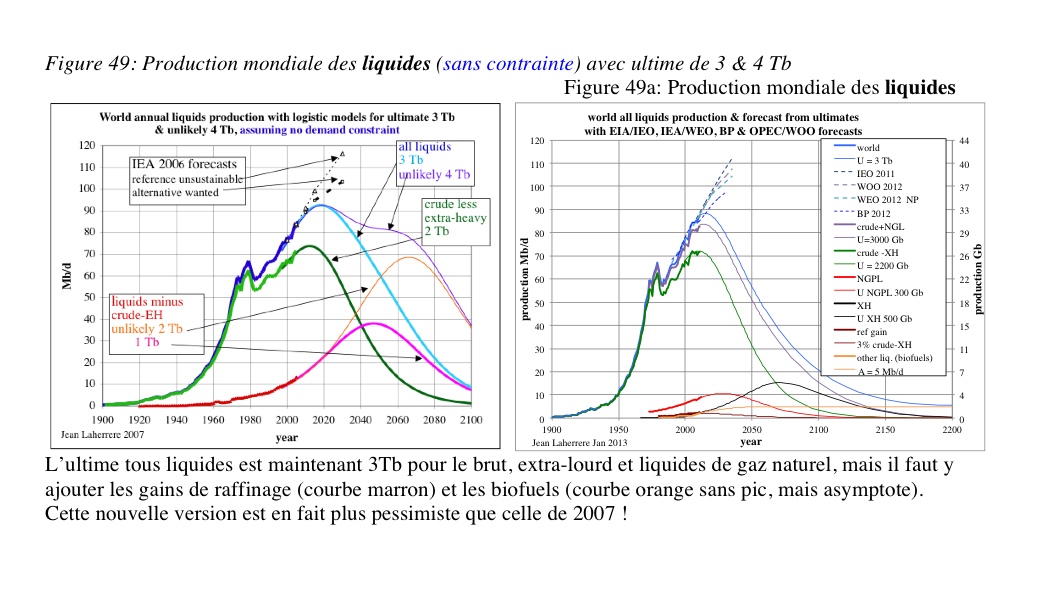
All liquids previsions 2007 and 2013 :
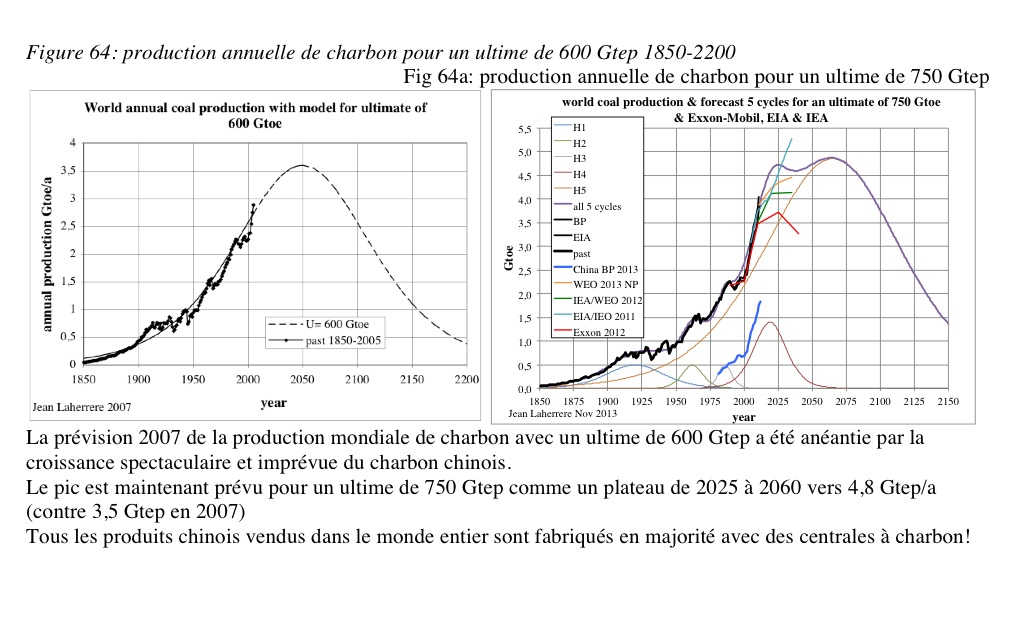
Coal previsions 2007 and 2013 :
Coal China :
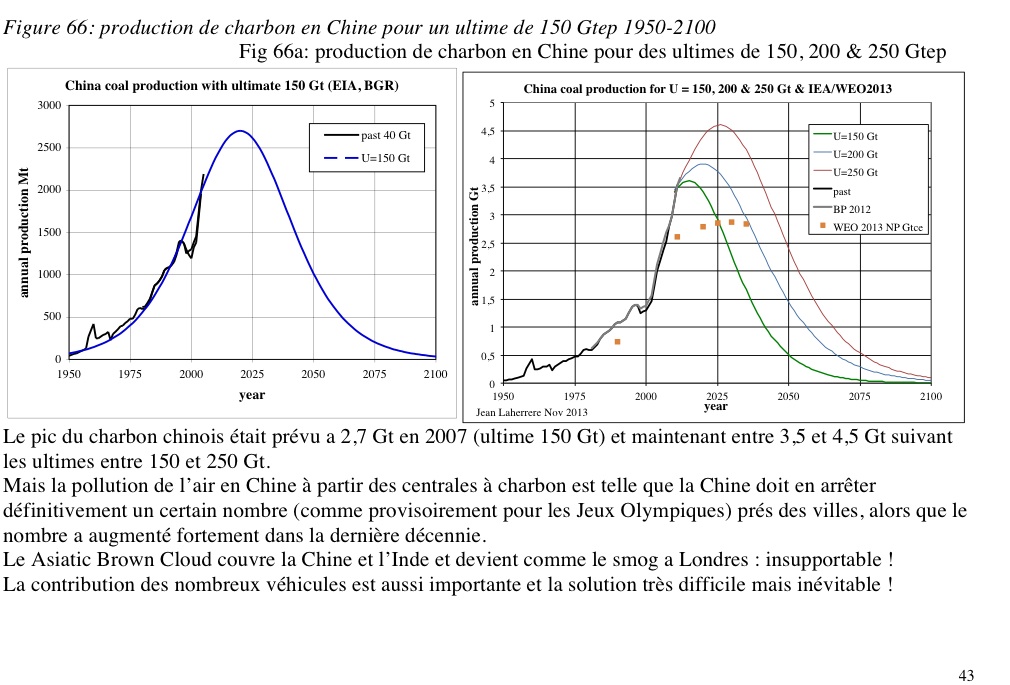
Note that the IEA (WEO 2013) forecasts China future coal prediction below the "possible", and probably the only thing they put below the possible ...)
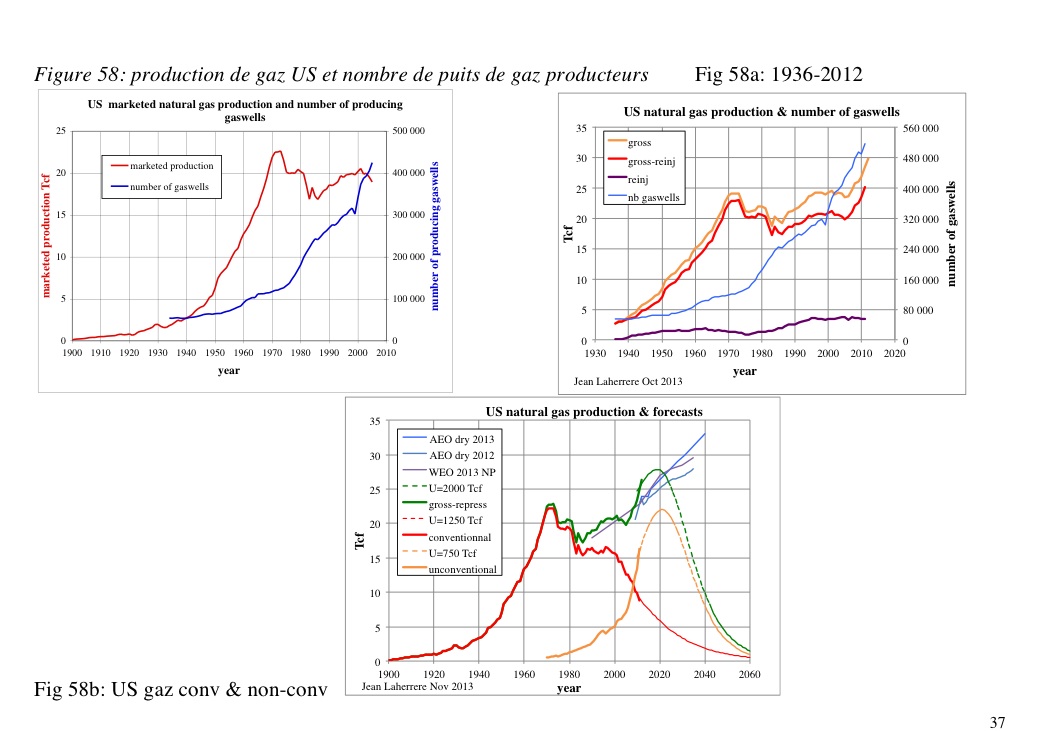
US natural gas :
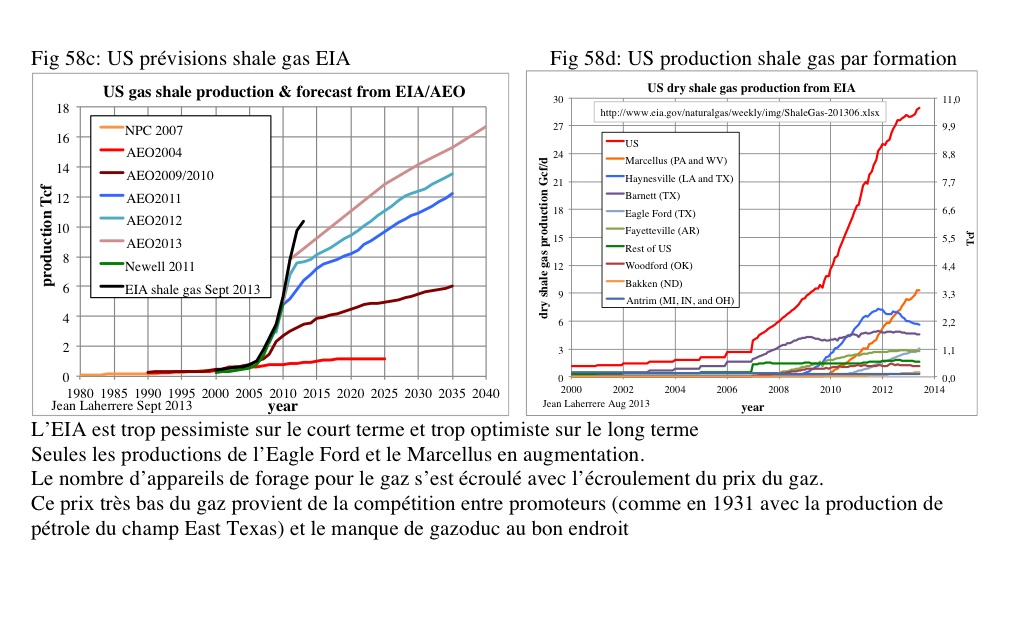
US shale gas :
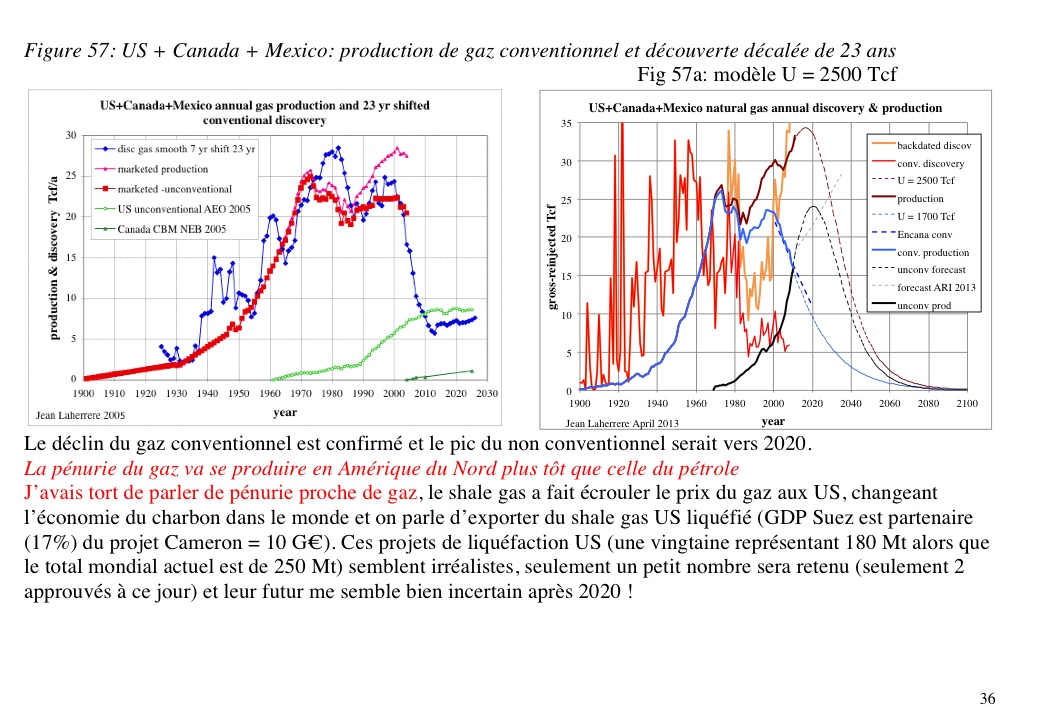
North America conventional gas :
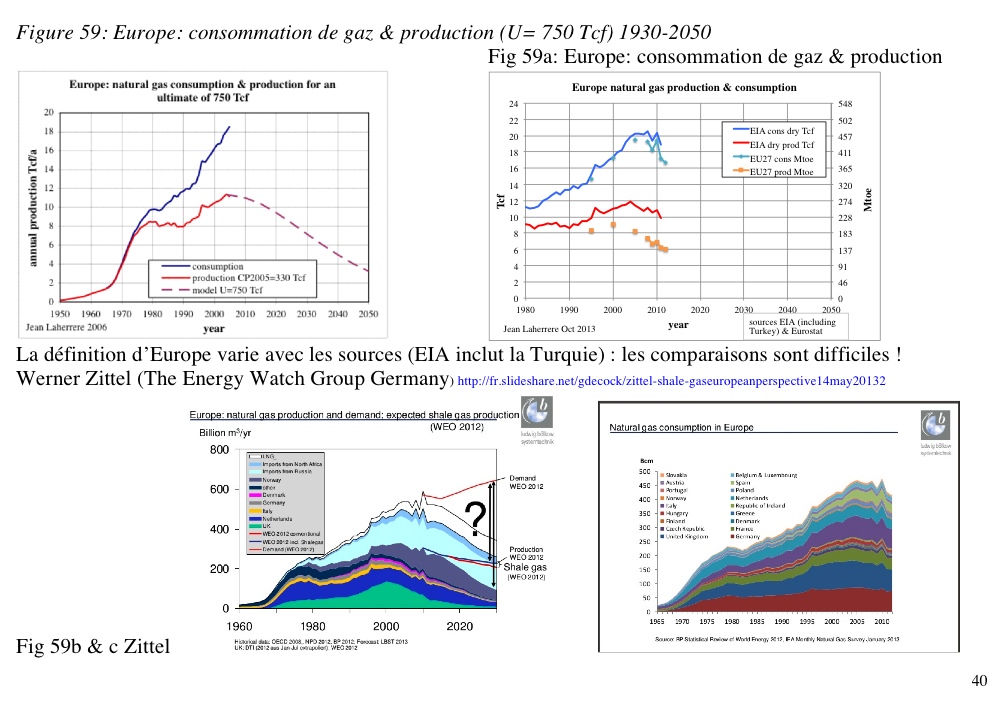
Europe gas :
Russian gas :
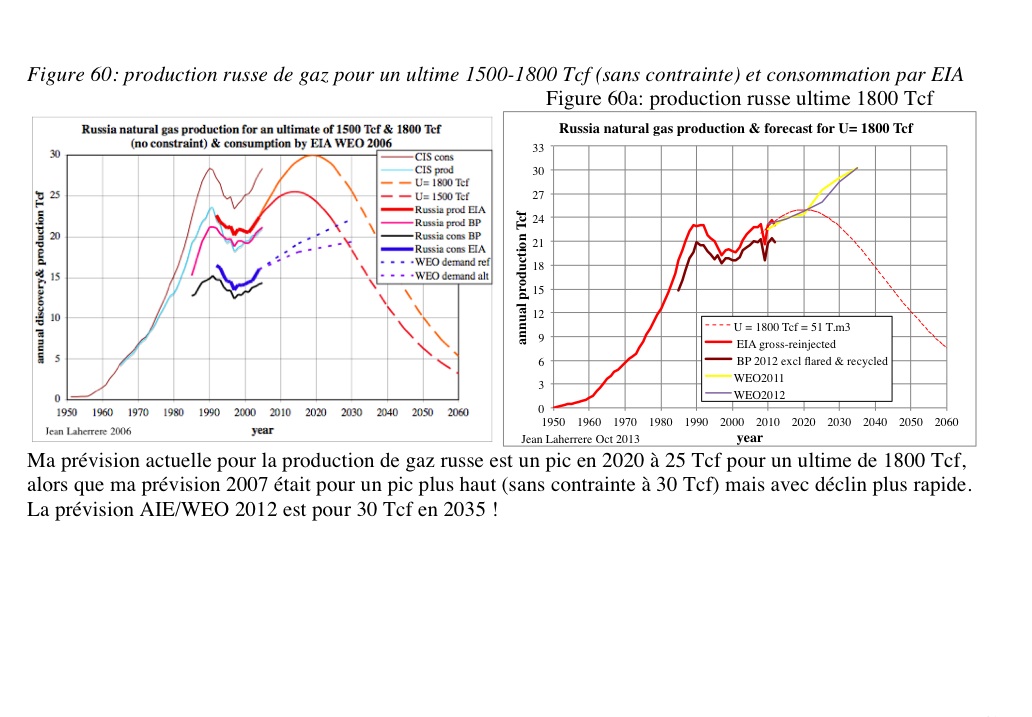
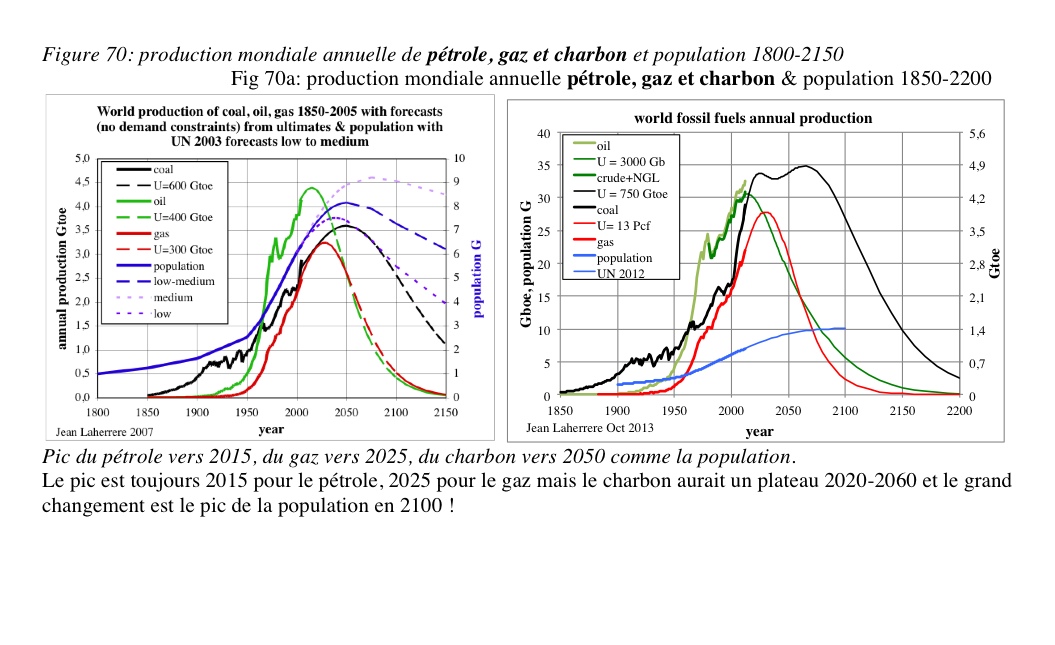
All fossils 2007 and 2013 :
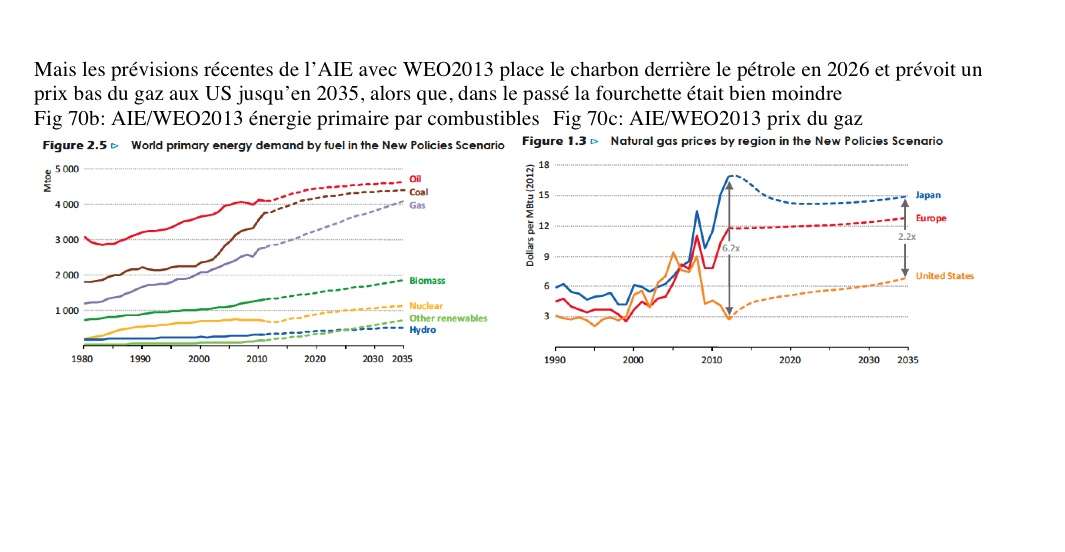
All fossils according to the IEA (WEO2013) :
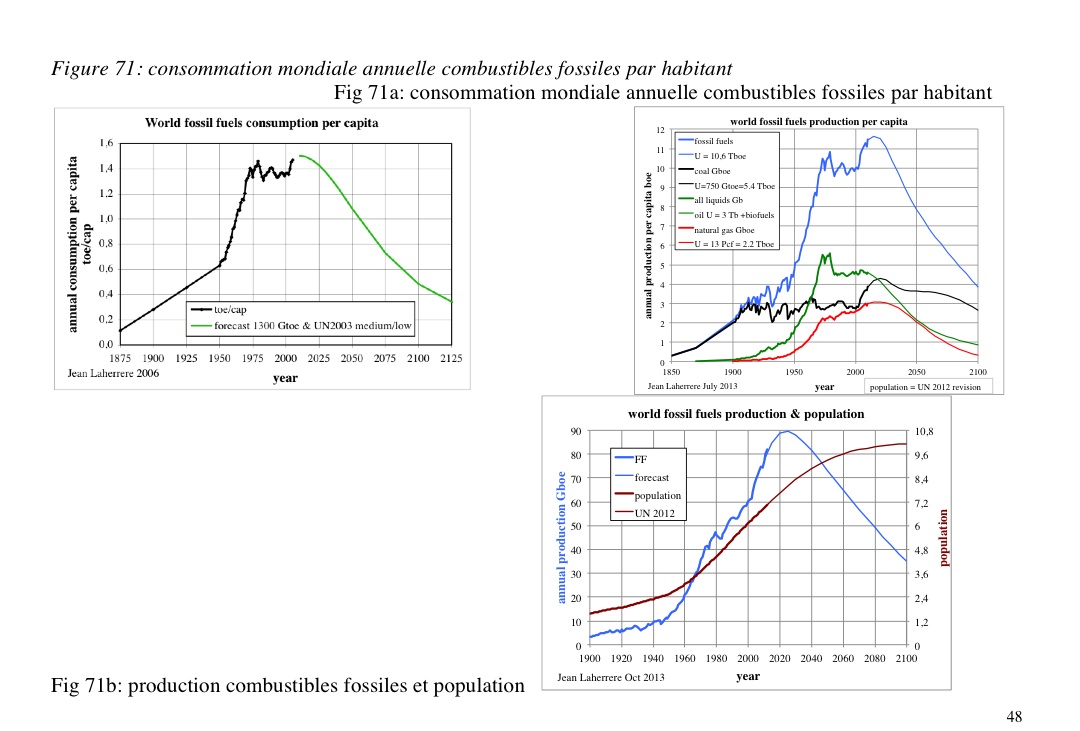
All fossils per capita :
All fossils US and GDP :

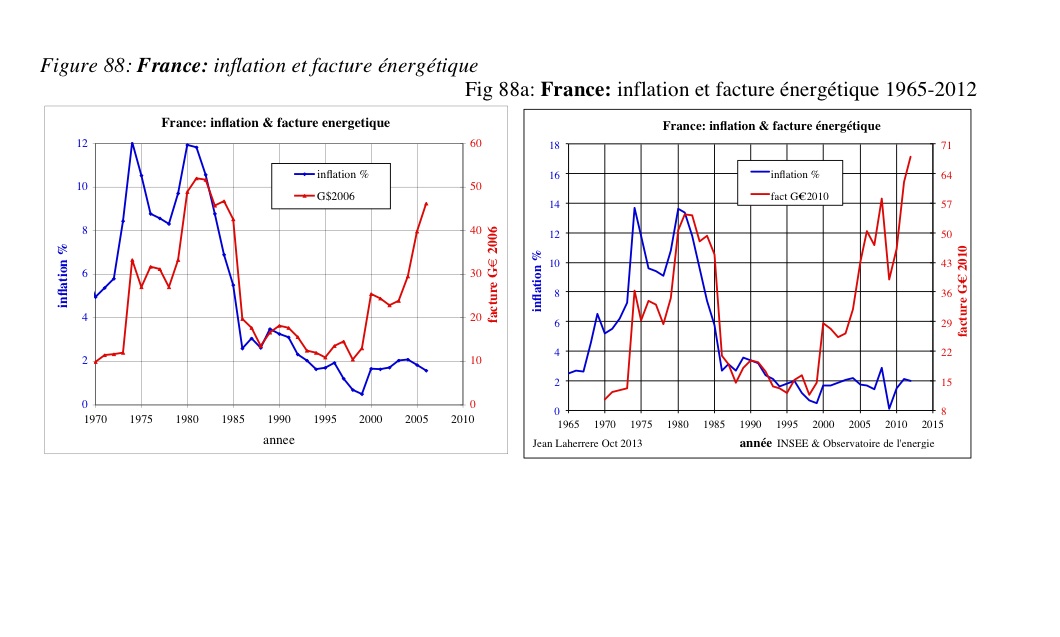
France and energy bill :
Posted: 01 Dec 2013, 11:50
by Little John
Hi Yves75, I don't know if it is easy to do, but it would help me a lot if you could reduce the size of the graphs a little as their current size is making it such that I have to scroll sideways as well as downwards to read posts on the thread.
Posted: 01 Dec 2013, 11:54
by Yves75
Ok, will try to reduce them a bit
Posted: 01 Dec 2013, 12:01
by Little John
Yves75 wrote:Ok, will try to reduce them a bit
Cheers mate.
Posted: 01 Dec 2013, 12:38
by Yves75
Something strange happening with wordpress.com now apparently (where the images are), but they should get to 800 max wide soon.
Posted: 02 Dec 2013, 13:48
by kenneal - lagger
All looking good now, Yves.
Posted: 02 Dec 2013, 13:56
by Little John
The bottom lot of graphs are still too big.


